How to See Your Competitors' Google Ads in 2026: 643 Ads From 8 SaaS Brands, Analyzed
TL;DR
- On Nov 16, 2026 we pulled 643 unique Google ad creatives from the public Google Ads Transparency Center for 8 B2B SaaS brands (HubSpot, Salesforce, monday.com, Notion, Asana, ClickUp, Pipedrive, Zoho), US region, with our Google Ads Transparency Center Scraper. Eleven runs, each finished in about 5 seconds.
- Creative mix varies a lot inside one category. Pipedrive's 40 most recent ads were 100% image. monday.com's were 45% video. Notion's were 32% video and 20% text.
- Some SaaS ads run for years. The median creative in Zoho's recent set had been running for 821 days. ClickUp's median was 560 days. Notion's was 145 days and monday.com's 162 days.
- Ads launch in bursts. Of 200 recent Salesforce creatives, 65 were first shown in March 2026. monday.com first showed 39 of its 200 in October 2026 alone.
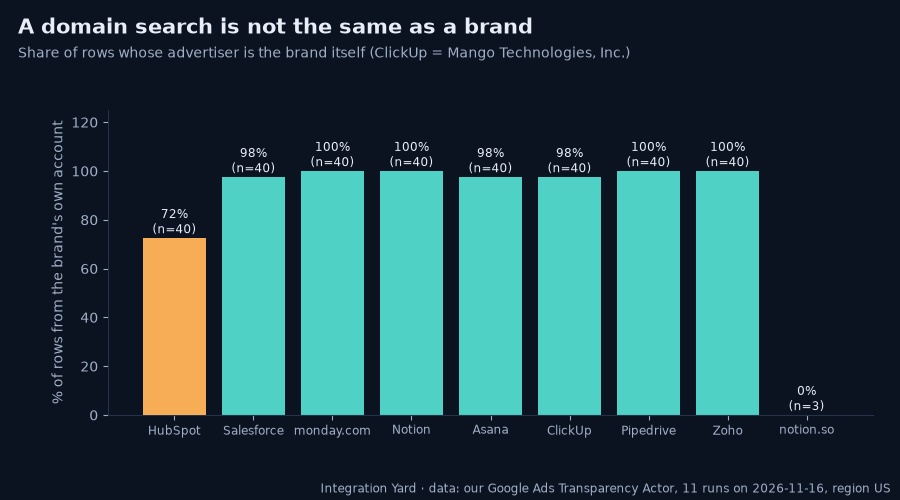
- A domain is not a brand. 11 of 40 rows for
hubspot.comcame from other advertisers such as agencies and app partners.notion.soreturned 3 unrelated advertisers, whilenotion.comreturned 40 Notion ads. ClickUp advertises under its legal name, Mango Technologies, Inc.- Cost at our list price: $0.99 per 1,000 ads plus $0.001 per run. A 40-ad competitor snapshot is about $0.04.
Want to try it? Open the Google Ads Transparency Center Scraper. The form opens with a ready nike.com search. Replace it with your competitor's domain and press Start. No Google account is needed.
If you run paid search, sell to marketers, or just want to know what a competitor is pushing this quarter, Google already publishes the answer. Since 2023 the Google Ads Transparency Center has shown the ads verified advertisers run on Search, YouTube, Display and Shopping, with the dates each creative was first and last shown. You can browse it one advertiser at a time in a browser. Once you want to compare eight competitors, check them every week, or feed the results to a spreadsheet or an AI assistant, clicking through the site stops working.
So we did the comparison properly. We picked eight well-known B2B SaaS brands that compete for the same buyers in CRM, work management and productivity, pulled their recent creatives as rows, and read the data like a marketer would. Below is what we found, what surprised us, and the traps to avoid when you do the same for your own market.
Disclosure: we build and maintain the Google Ads Transparency Center Scraper used in this guide.
Contents
- What we ran
- What each row contains
- Finding 1: same category, very different creative mix
- Finding 2: some ads run for years
- Finding 3: how fresh is a competitor's ad set?
- Finding 4: ads launch in bursts
- Finding 5: a domain search is not the same as a brand
- What it costs
- Six ways teams use this data
- A weekly competitor ad check in four steps
- Limits and good practice
- FAQ
What we ran
On Monday, Nov 16, 2026, between about 10:28 and 10:40 AM Pacific, we ran the Google Ads Transparency Center Scraper with the region set to the United States and all ad formats included. We used one run per brand so each brand's results stayed separate:
- 40 creatives each for
hubspot.com,salesforce.com,monday.com,notion.com,asana.com,clickup.com,pipedrive.comandzoho.com. - 200 creatives each for
monday.comandsalesforce.com, to look at launch timing in more depth. - One extra run for
notion.so, Notion's old domain. That one is a lesson, covered in Finding 5.
All 11 runs succeeded, each in roughly 5 seconds. Together they returned 723 rows. The deeper pulls repeat the 40-row samples, so the total is 643 unique creatives. Nothing was filtered afterward. Each number below comes from those rows.
One caution about what the sample means. Every creative in the eight brand samples had a last-shown date within the past week. The Transparency Center appears to list recently active creatives first, so a 40-row pull is best read as "what this brand is running right now", not as its full ad history. Big advertisers have thousands of creatives on file, and we did not try to pull them all.
What each row contains
Each creative comes back as one row:
| Field | What it tells you |
|---|---|
advertiserName, advertiserId |
The verified advertiser account that paid for the ad |
domain, query |
The domain you searched and the query that produced the row |
format |
image, video or text |
firstShownIso, lastShownIso |
When Google first and last showed the creative in the region |
shownForDays |
Days between first and last shown, worked out for you |
imageUrl, previewUrl |
A preview of the creative, for image ads |
creativeId, sourceUrl |
A stable id and a link back to the creative on the Transparency Center |
region, scrapedAt |
Region requested and when the row was collected |
Completeness was high. All 723 rows had an advertiser name and id, a format, first and last shown dates, and days shown. 513 of the 545 image rows (94%) had a preview image URL. Video and text creatives always come with their dates and a link back to the Transparency Center, where you can watch or read them. You can export the results as JSON, CSV or Excel, or as a compact JSON copy that is cheaper for an AI assistant to read.
Finding 1: same category, very different creative mix
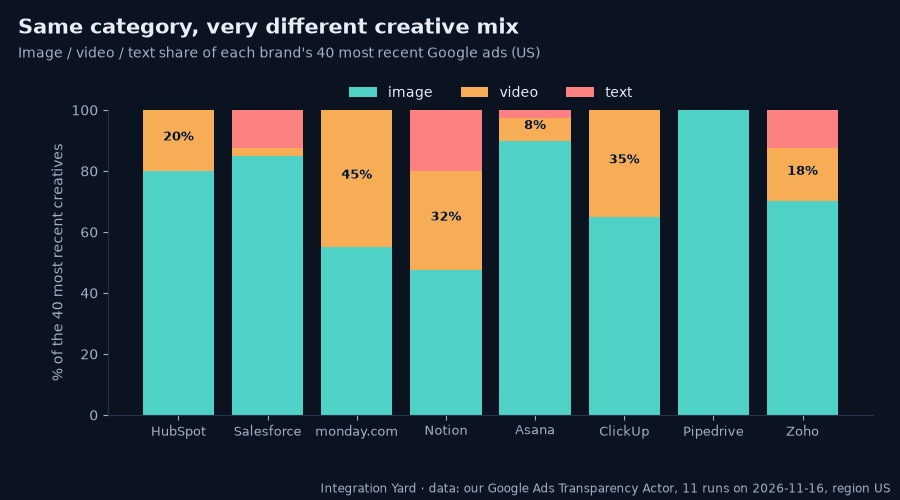
These eight companies sell to similar buyers, yet their recent Google ads look nothing alike:
- Pipedrive: 40 of 40 image. No video and no text ads in its recent set.
- Asana: 36 image, 3 video, 1 text. Mostly static.
- Salesforce: 34 image, 5 text, 1 video. The deeper pull agrees: 187 of 200 were image ads and only 2 were video.
- HubSpot: 32 image, 8 video.
- Zoho: 28 image, 7 video, 5 text.
- ClickUp: 26 image, 14 video.
- monday.com: 22 image, 18 video. In the 200-creative pull, 82 were video (41%).
- Notion: 19 image, 13 video, 8 text. The most even mix of the eight.
Why it matters: the format mix tells you where a competitor is spending creative effort. A video-heavy set usually means YouTube and video placements are part of the plan. An image-only set points to Display and remarketing. If your two closest competitors are both investing in video and you have none, that is a gap worth discussing. If nobody in your category runs video, it may be an opening.
Finding 2: some ads run for years
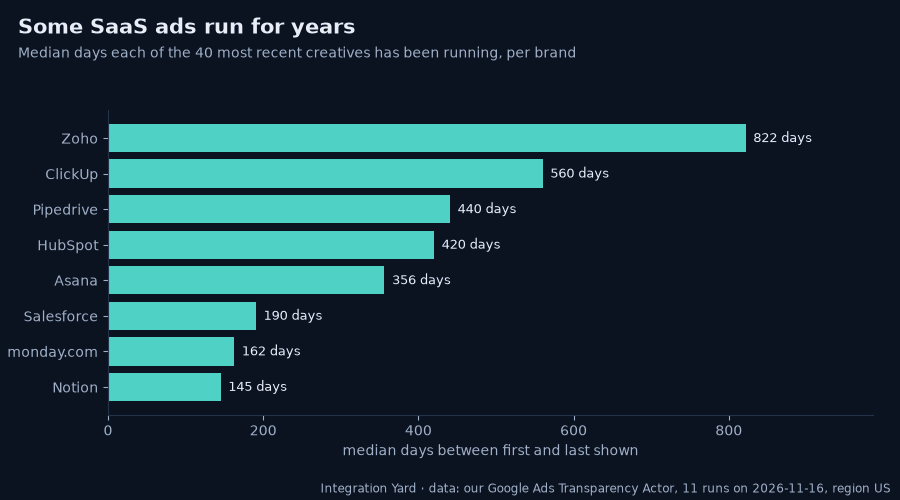
shownForDays is the time between the first and last date Google showed a creative. For each brand's 40 most recent creatives, the median was:
| Brand | Median days shown | Oldest first-shown date in the sample |
|---|---|---|
| Zoho | 821 | 2021-12-11 |
| ClickUp | 560 | 2023-04-05 |
| Pipedrive | 440 | 2025-07-02 |
| HubSpot | 420 | 2021-10-25 |
| Asana | 356 | 2025-03-25 |
| Salesforce | 190 | 2024-04-03 |
| monday.com | 162 | 2021-10-25 |
| Notion | 145 | 2026-04-29 |
The median Zoho creative that is still being shown has been running for more than two years. Notion's recent set is much younger: none of its 40 started before April 2026.
How to read this: an ad that keeps running for a year or more is usually an ad that works, because advertisers pause creatives that don't. Long-running creatives are the closest thing to a public "this converts" signal you will get from a competitor. Open those first. Their headline angle, offer and visual style are what the competitor's own testing kept.
The reverse is useful too. A brand whose recent set is all young, like Notion's here, is either testing heavily or has just refreshed its messaging. Check again in a month to see which new ads survived.
Finding 3: how fresh is a competitor's ad set?
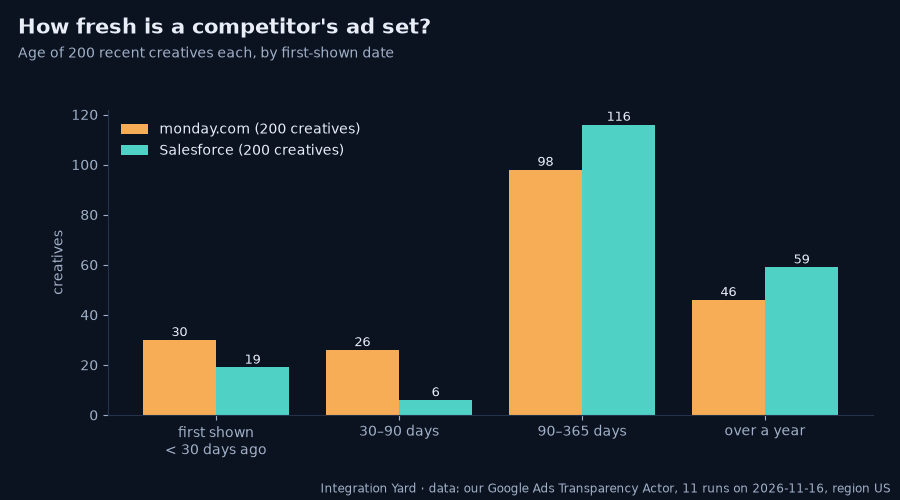
For monday.com and Salesforce we pulled 200 creatives each and grouped them by first-shown date:
| First shown | monday.com | Salesforce |
|---|---|---|
| Less than 30 days ago | 30 | 19 |
| 30 to 90 days ago | 26 | 6 |
| 90 to 365 days ago | 98 | 116 |
| More than a year ago | 46 | 59 |
Both brands keep a large core of creatives that have run for 3 to 12 months. That core is the base of their always-on spend. monday.com adds new creatives faster: 56 of its 200 (28%) started in the last 90 days, against 25 (12.5%) for Salesforce.
For your own tracking, the useful number is the under-30-day count. Pull it every week. When it jumps, the competitor is launching something: a new feature, a price change, or a seasonal push. You will usually see it in their ads before the press release.
Finding 4: ads launch in bursts
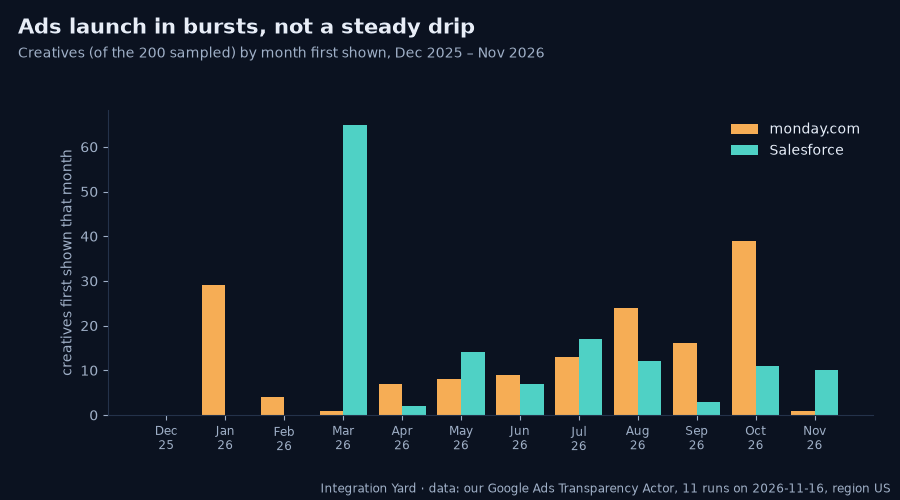
Counting the 200 creatives by the month they were first shown shows a clear pattern. New ads arrive in waves:
- Salesforce: 65 of 200 creatives were first shown in March 2026, and another 44 in June 2025. Most other months added between 0 and 17.
- monday.com: 39 creatives first shown in October 2026, 29 in January 2026, and 24 in August 2026. Quieter months added 0 to 16.
A wave like Salesforce's March 2026 batch usually lines up with a product launch, a rebrand, or the start of a fiscal planning cycle. For a competitor you care about, line these bursts up with their release notes, events and pricing changes. Over a few quarters you will learn their calendar, and you can plan your own pushes to land before theirs or in the quiet gaps between them.
You can only see this if you collect dates as data. On the Transparency Center website each creative is a tile, and you would have to open hundreds of them to rebuild this chart.
Finding 5: a domain search is not the same as a brand
This is the trap most people fall into, and it has three versions in our data.
Other advertisers show up under a brand's domain. For hubspot.com, 29 of 40 rows came from HubSpot's own accounts ("Hubspot, Inc." and "HubSpot"). The other 11 came from 11 different advertisers, including at least one marketing agency and several smaller software and services companies. For the other brands, 39 or 40 of 40 rows were the brand's own. Platforms with big partner ecosystems will show this the most.
Old domains can point you at the wrong ads. Notion moved from notion.so to notion.com. Searching notion.so returned just 3 creatives, all from unrelated advertisers (two Australian companies and one Canadian). Searching notion.com returned 40 creatives, all from Notion Labs, Inc. If a brand has rebranded or changed domain, search the current one.
Brands often advertise under their legal entity name. ClickUp's ads run under Mango Technologies, Inc. If you search the Transparency Center by advertiser name for "ClickUp", you can miss them. Searching by domain, or by advertiser id once you know it, avoids the problem.
The fix takes a minute. After your first pull, look at the advertiserName column, decide which accounts are really your competitor, and filter to those. Then save the advertiser id (it starts with AR) and use it for later runs. An id always points at exactly one advertiser.
What it costs
The scraper uses pay-per-event pricing: $0.001 per run plus $0.99 per 1,000 ads returned. Rows for a blocked or invalid query come back as free error rows, and a query that matches nothing costs only the start fee.
| Job | Ads | Approximate cost |
|---|---|---|
| One competitor snapshot (40 most recent ads) | 40 | $0.04 |
| This whole guide (11 runs) | 723 | $0.73 |
| 8 competitors, 40 ads each, every week for a year | 16,640 | about $17 |
| One deep pull of 1,000 creatives | 1,000 | about $0.99 |
It runs on the Apify Free plan, which includes monthly platform credit, so a weekly check of a few competitors fits inside it. You can also set a spend cap per run so a large query never costs more than you planned.
Six ways teams use this data
- Competitive creative reviews. Pull your top five competitors once a month. Open the longest-running creatives first and note their angles and offers.
- Launch detection. Track the under-30-day count weekly. A spike is an early sign of a product or pricing move.
- Agency pitches and audits. Show a prospect what their competitors are running, with dates, before the first meeting. A 40-ad snapshot per competitor costs pennies.
- Format planning. Compare format mix across your category before you decide whether to fund video.
- Brand and partner monitoring. See which third parties advertise using your domain. The HubSpot result above is a normal example of this.
- Feeding an AI assistant. Ask the assistant to "summarize what changed in our competitors' Google ads this month" and give it the compact export, or connect the scraper through the Apify MCP server so the assistant can run it directly.
A weekly competitor ad check in four steps
- Pick the domains. Use each competitor's current main domain. After the first run, note their advertiser ids from the results.
- Set the window. Set a "since" date a week back so each run keeps only creatives shown in the last seven days.
- Save it as a task and schedule it. In Apify Console, save the input as a Task and add a weekly Schedule.
- Send the results where you work. Google Sheets, Slack, a webhook, Make, Zapier or n8n all connect directly. Most teams only read the new-creative rows each week.
Two runs a week apart tell you more than one big pull. The change between snapshots is the signal.
Limits and good practice
- This is public Transparency Center data. You get the creative, advertiser, format and the dates shown. Google does not publish spend, impressions or targeting for commercial ads in the US, so no tool that reads this source can give them to you.
- Regions differ. We used the US. The same brand often runs different creatives in Germany or India. Set the region you sell in.
- A sample is a sample. We took the 40 or 200 most recent creatives per brand. That shows what is running now. It is not a full history or a market study.
- Previews. Most image ads (94% in our run) include a preview image URL. Video and text creatives come with their dates and a link to view them on the Transparency Center.
- Busy periods. Google sometimes rate-limits many simultaneous requests. The scraper retries, and if a query still fails it records a free error row and finishes the rest of the run. Running competitors in sequence, as we did, avoids most of this.
- Use the data responsibly. It is public advertising information. Use it for research and planning. Don't copy competitors' creatives or trademarks.
FAQ
Is there an official Google Ads Transparency Center API? Google does not offer a public API for searching other advertisers' creatives. The Transparency Center website is free to browse. The scraper turns that same public information into rows you can export or schedule, with no Google account.
How do I see my competitors' Google ads? Open the Google Ads Transparency Center and search a competitor's domain or advertiser name. To compare several competitors or track them over time, run the Google Ads Transparency Center Scraper with their domains and export the results to CSV, Sheets or JSON.
Can I see how much a competitor spends on Google Ads? No. For commercial ads in the US, the Transparency Center shows creatives, formats and dates shown, not spend or impressions. How long a creative keeps running and how often new ones launch are the best public proxies for what is working.
Why do I see other companies' ads when I search a competitor's domain?
Partners, resellers and agencies sometimes run ads that point at a well-known brand's domain. In our run, 11 of 40 rows for hubspot.com came from other advertisers. Filter by advertiserName, or search by the competitor's advertiser id.
Does it cover YouTube and Shopping ads? It covers the creatives the Transparency Center lists for an advertiser, which include image, video and text formats across Google's networks. You can filter by format.
Can I filter by date or country?
Yes. Set the region with a two-letter country code such as us, de or gb. Use the since and until dates to keep only creatives shown in a window. Rows outside the window are dropped and not charged.
How much does it cost? $0.99 per 1,000 ads plus $0.001 per run. A 40-ad snapshot of one competitor costs about $0.04. It runs on the Apify Free plan.
Can an AI agent use this? Yes. Use it through the Apify MCP server or API, and ask for the compact output for a smaller, cheaper-to-read copy of the same rows.
Run your own competitor check with the Google Ads Transparency Center Scraper. Related guides: catch Google Merchant Center disapprovals before Google does and get an alert when a competitor changes prices.